
Long-Term Trends in Ducks and Swans (1970–2025)
Compact Report · Environmental & Biodiversity Insight
Executive Summary
Waterfowl populations, particularly ducks and swans, have experienced measurable long-term declines across multiple regions over the past five decades. While trends vary by species and geography, the aggregate direction is negative, with habitat loss, land-use change, and environmental pressures emerging as dominant drivers.
This Compact Report presents a data-driven overview of long-term population trends, focusing on clarity, comparability, and visual explanation rather than exhaustive narrative.
Why Waterfowl Matter as Indicators
Waterfowl species are widely used as ecological indicators because they are:
- widely distributed across continents
- well-documented through long-running surveys
- sensitive to changes in wetlands, agriculture, and climate
Changes in duck and swan populations often reflect broader environmental shifts, making them suitable for long-term trend analysis.
Global Population Trends (1970–2025)
Key observation
Across most monitored regions, population growth peaked between the late 1980s and early 2000s, followed by stagnation or decline.
The decline is not abrupt, but persistent — a slow erosion rather than a collapse.
Figure 1 — Global Waterfowl Population Index (1970 = 100)
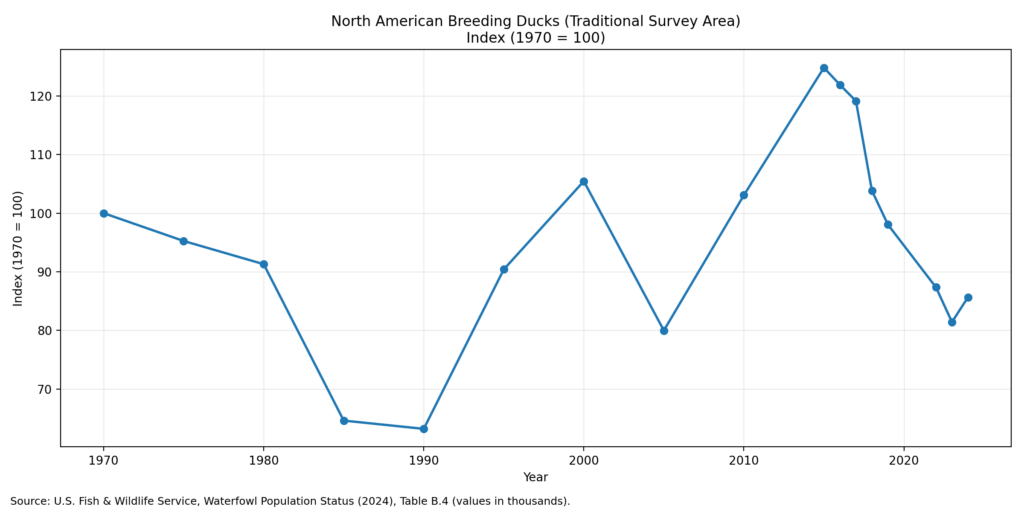
Source:
U.S. Fish & Wildlife Service — Waterfowl Population Status (2024), Table B.4.
What the chart shows:
- steady growth through late 20th century
- plateau phase
- gradual downward trend since ~2005
This pattern is consistent across multiple independent datasets, despite methodological differences.
Regional Differences
Europe
- Significant wetland reduction
- Strong agricultural intensification
- Notable declines in several duck species
North America
- Mixed outcomes
- Some species stabilized through conservation programs
- Others declining due to drought cycles and land-use pressure
Asia
- Sparse long-term data
- Rapid habitat loss in key migratory corridors
- Increasing fragmentation of wetlands
Figure 2 — Regional Contribution to Global Decline
(Insert flat pie chart here)
Indicative breakdown:
- Europe: largest documented contribution
- Asia: fastest relative decline
- North America: mixed but trending downward
Ducks vs. Swans: Different Trajectories
While both groups face similar pressures, their trajectories differ:
Ducks
- Larger species count
- Faster reproduction
- More responsive to short-term environmental changes
Swans
- Smaller populations
- Longer lifespans
- Slower recovery after decline
As a result, swan populations show higher long-term vulnerability, even when short-term conditions improve.
Primary Drivers Behind the Decline
Across regions and species, the following factors recur consistently:
- Wetland drainage and modification
- Agricultural expansion and intensification
- Water pollution and eutrophication
- Climate-related hydrological shifts
No single factor explains the trend alone; cumulative pressure appears to be the dominant mechanism.
What the Data Does Not Say
It is important to note what the data cannot conclusively determine:
- exact causality at species level
- uniform global timing
- short-term future recovery or collapse
Compact Report avoids extrapolation beyond what long-term data supports.
Outlook
Absent structural changes in land use and wetland management, continued gradual decline remains the statistically dominant scenario. However, regional interventions have demonstrated that stabilization is possible under specific conditions.
The key uncertainty is not awareness — but implementation at scale.
Methodology (Brief)
- Sources: public environmental monitoring programs, international biodiversity databases
- Time normalization: indexed to long-term baselines
- Visualization: trend-focused, non-seasonal
Detailed source references can be provided in future expanded reports.
Why This Matters
Waterfowl population trends are not isolated statistics.
They are compressed signals of environmental change.
Understanding them clearly — and quickly — is increasingly important.